| ||
NAVIGATION CONTROLS | ||
| ROTATE | ZOOM | PAN |
| Left Button + Move | Wheel Rotation | Right Button + Move |
WARNING | ||
|
Depending on your internet connection speed you may have to wait | ||

 Help
Help
| |
|
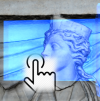
The visible-induced IR luminescence (VIL) imaging plays a key role in the characterization of the Egyptian blue pigment. It captures the fluorescence effects in the IR-spectrum when the Egyptian blue is illuminate by a light with only radiation in the visible spectrum. | |
Tooltip | |
 |
Click on the highlighted areas to get specific information |
| |
|
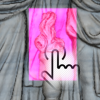
The ultraviolet-induced (visible) luminescence (UVL) imaging allow us to investigate the distribution of luminescent materials, such as organic binders and colourants. Specifically this image is useful in the characterisation of the spatial distribution of rose madder lake on surface. In this case, the image captures the fluorescence effects in the visible spectrum when the madder lake is illuminated by an UV light. | |
Tooltip | |
 |
Click on the highlighted areas to get specific information |
| |
|
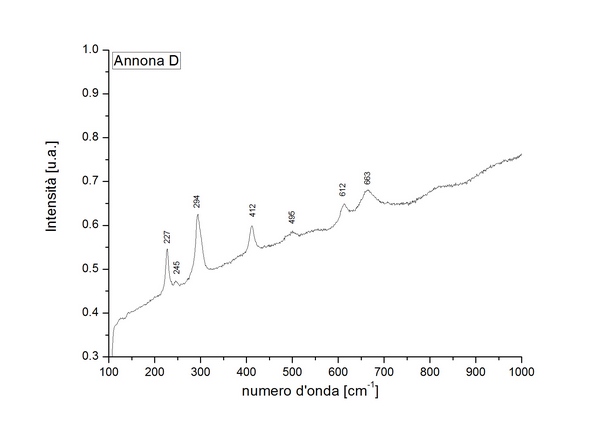
The micro-samples were examined by Raman spectroscopy using a Renishaw Raman Invia instrument and an XploRA Horiba Jobin-Yvon microscope. | |
Tooltip | |
 |
Click on the highlighted areas to get specific information |
| |
|
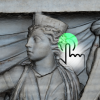
Optical microscopy allows a preliminary analysis of the micro-samples, which were investigated with a WILD Herbrugo M10 stereomicroscope with variable magnification. The crushed-grains were then observed by means of Leitz Orthoplan-pol microscope in reflected and transmitted light (under crossed and uncrossed polars). The microscope was also provided with a PloemOpak fluorescence illuminator and a filter cube (excitation filter BP 340-380 nm) for examination under UV light; the ultra-violet light source was an HBO 200W high pressure mercury vapour lamp. Usual magnifications were from 4x to 40x, and 63x oil immersion. | |
Tooltip | |
 |
Click on the highlighted areas to get specific information |
| |
|
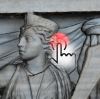
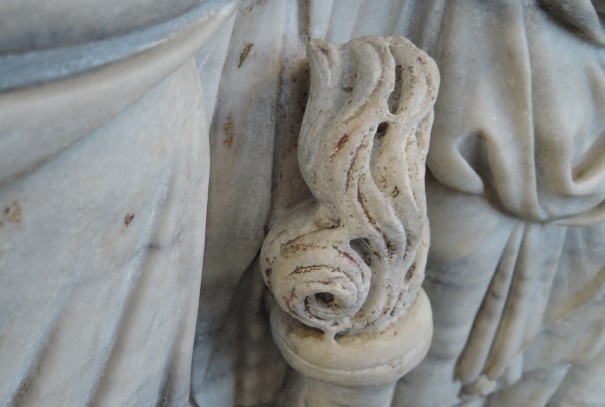
The "in-depth analysis" item represents a guided navigation about different polychrome issues, such as the underlining of the more preserved colour area, or some polychrome details useful for the virtual reconstruction, or again the elements that attested particular events like an ancient or modern re-painting/restoration. In this case you can focused the attention on the inferior ornamental edges of the palla over the stola and interior tunic of figures. | |
Tooltip | |
 |
Click on the highlighted areas to get specific information |
|
|
|
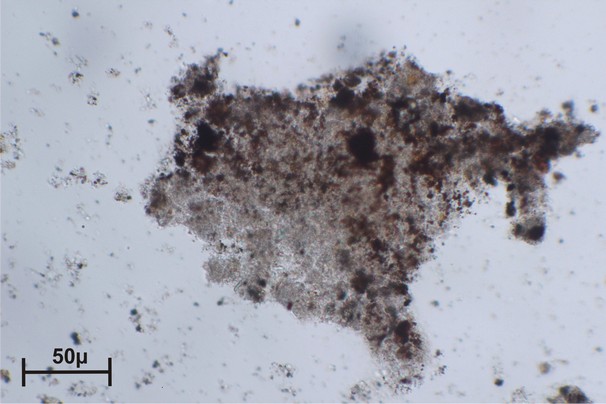
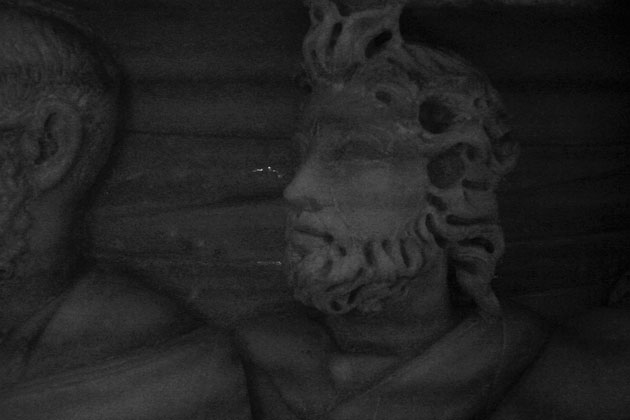
The dark yellow to brown micro-sample, named Annona 40799-C, was taken from a lock of hair at the back left of the Annona head (Figure 1). The crushed-grains preparation (Figure 2) is made of calcite particle size ranging from microcrystalline to coarse mesocrystalline. Frequent yellow-orange and more rarely bright red patches are observed in 45 degree spot and reflected light. Their optical features are those of iron oxides and hydroxides. The gold leaf is characterized by non homogeneous and riddled with holes feature. |

|
|
|
|
|
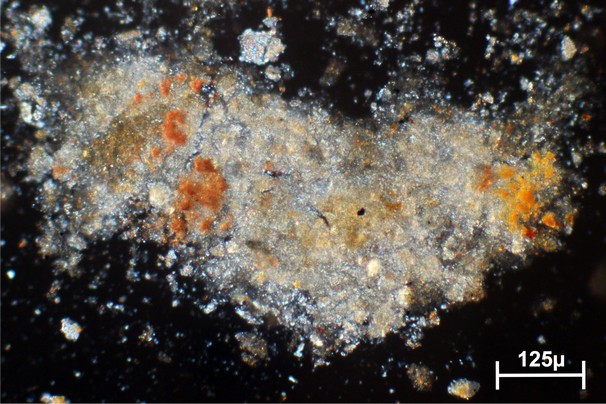
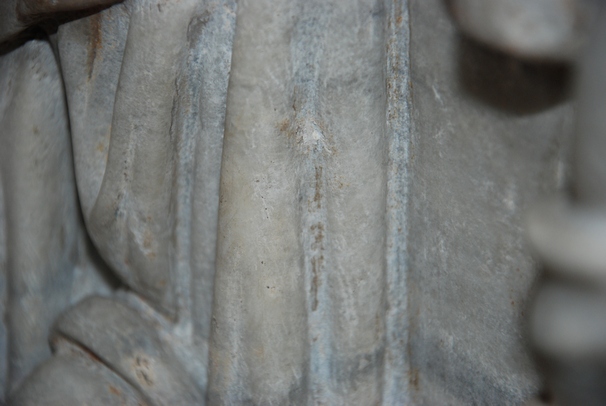
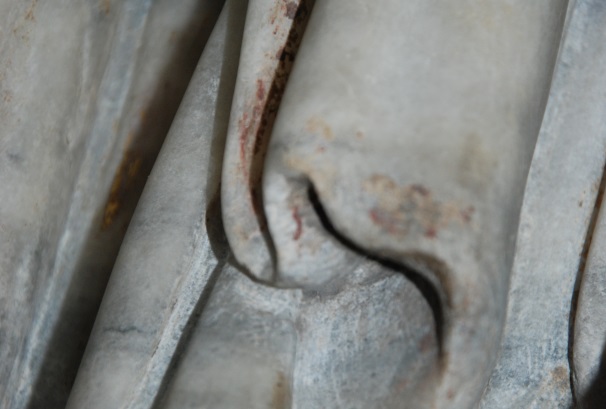
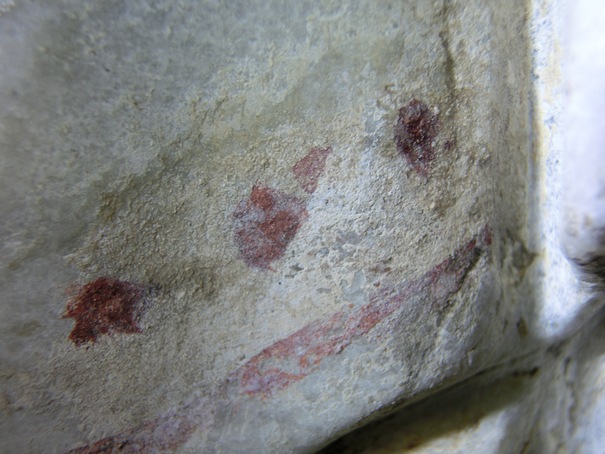
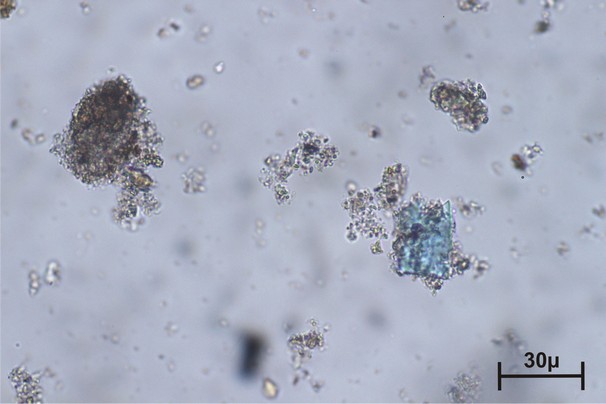
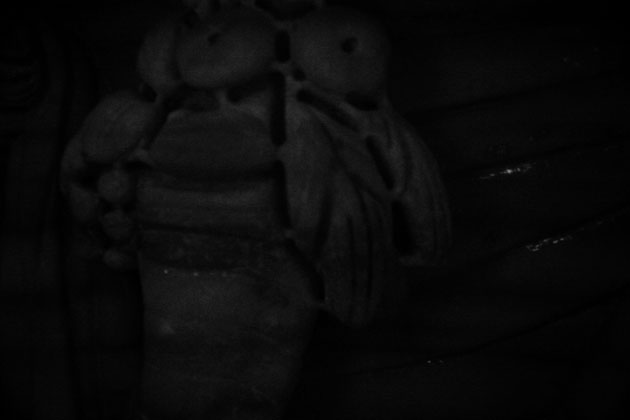
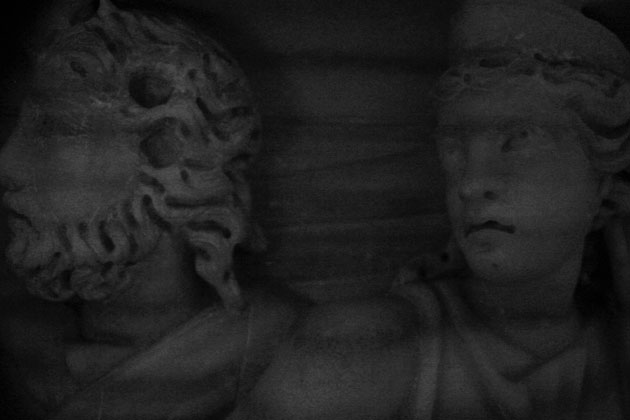
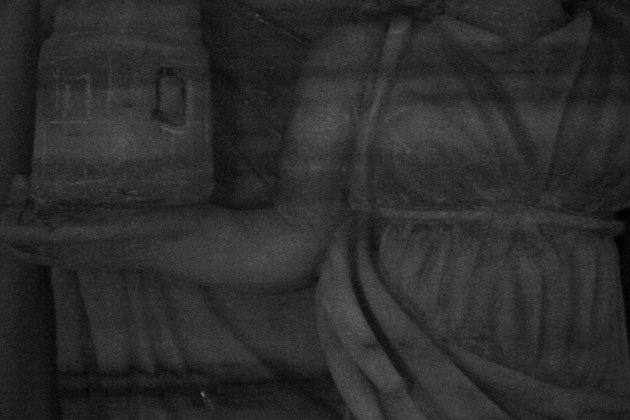
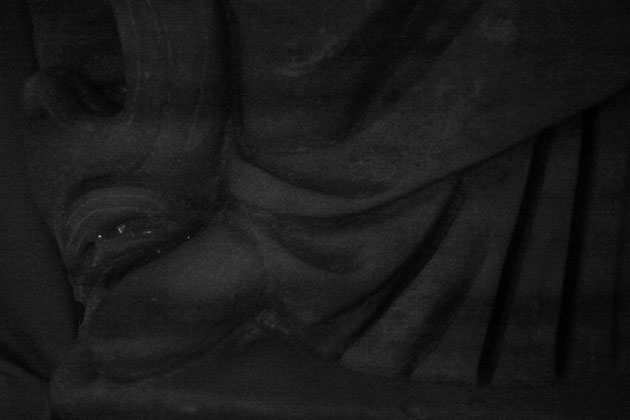
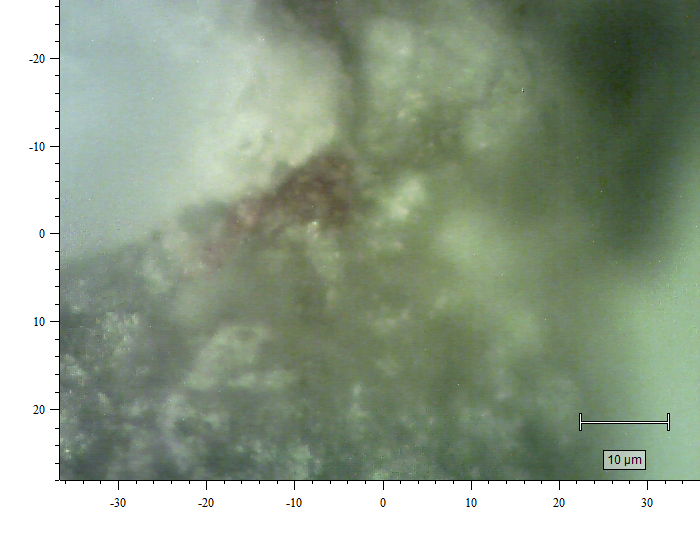
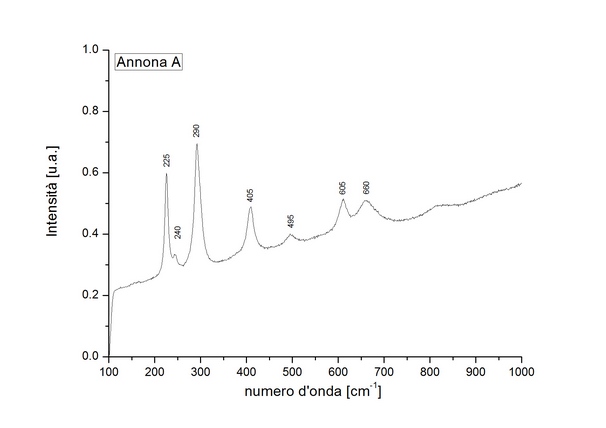
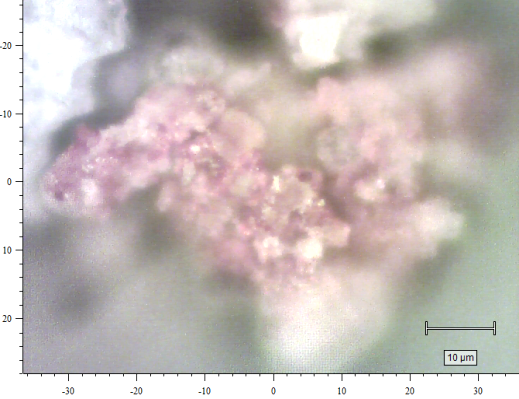
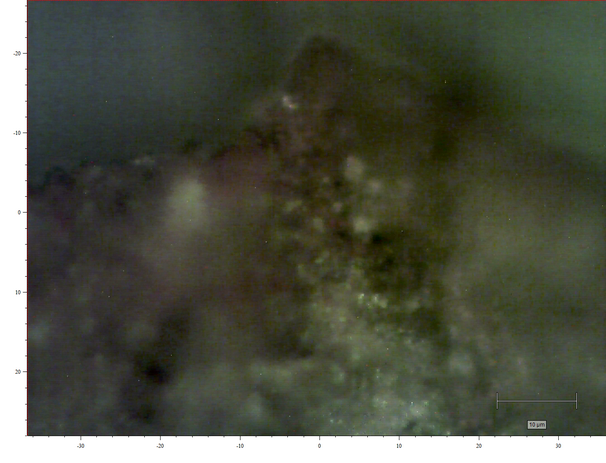
The reading of the crushed-grains of the Annona 40799-A micro-sample, taken from a ornamental edge hidden point of Annona's palla (Figure 1), has not allowed us to see the stratigraphic sequence, but the observation of patches made of microcrystalline texture natural calcium carbonate (Figure 2), which incorporates dark red to yellow-orange granules attributable to iron oxides and hydroxides, suggests the use of a white lime pigment. The ornamental dark red bands (Figure 3) are made of haematite and red-based ochre pigments; that was also proved by Raman spectroscopy. The presence of Egyptian blue crystals (Figure 4), combined with the VIL imaging results, lead us to assume that it was mixed with white lime to produce a glowing shades of white. |
|
|
|
|
|
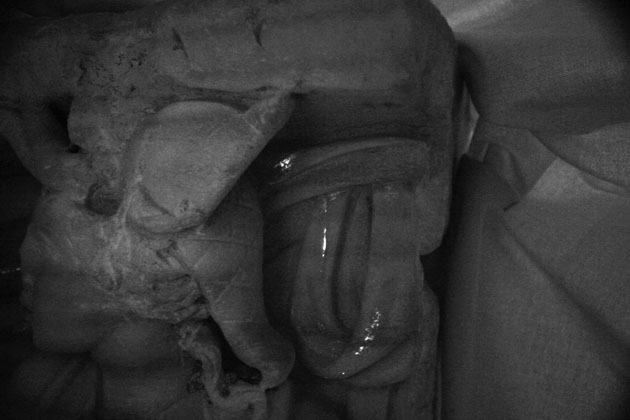
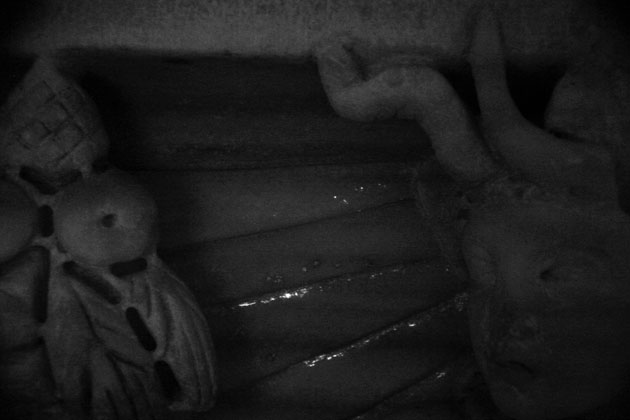
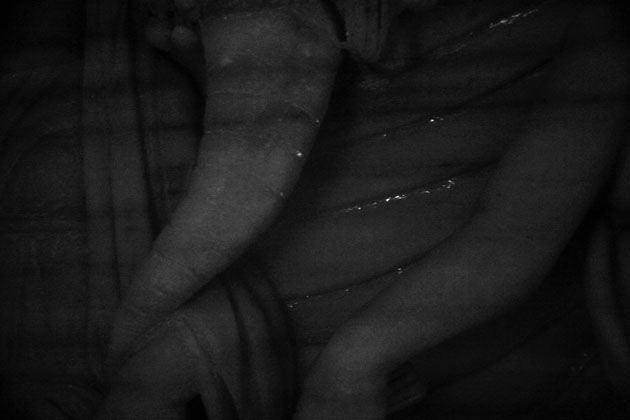
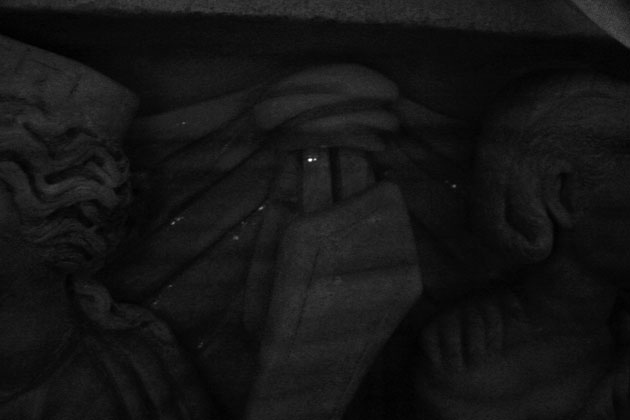
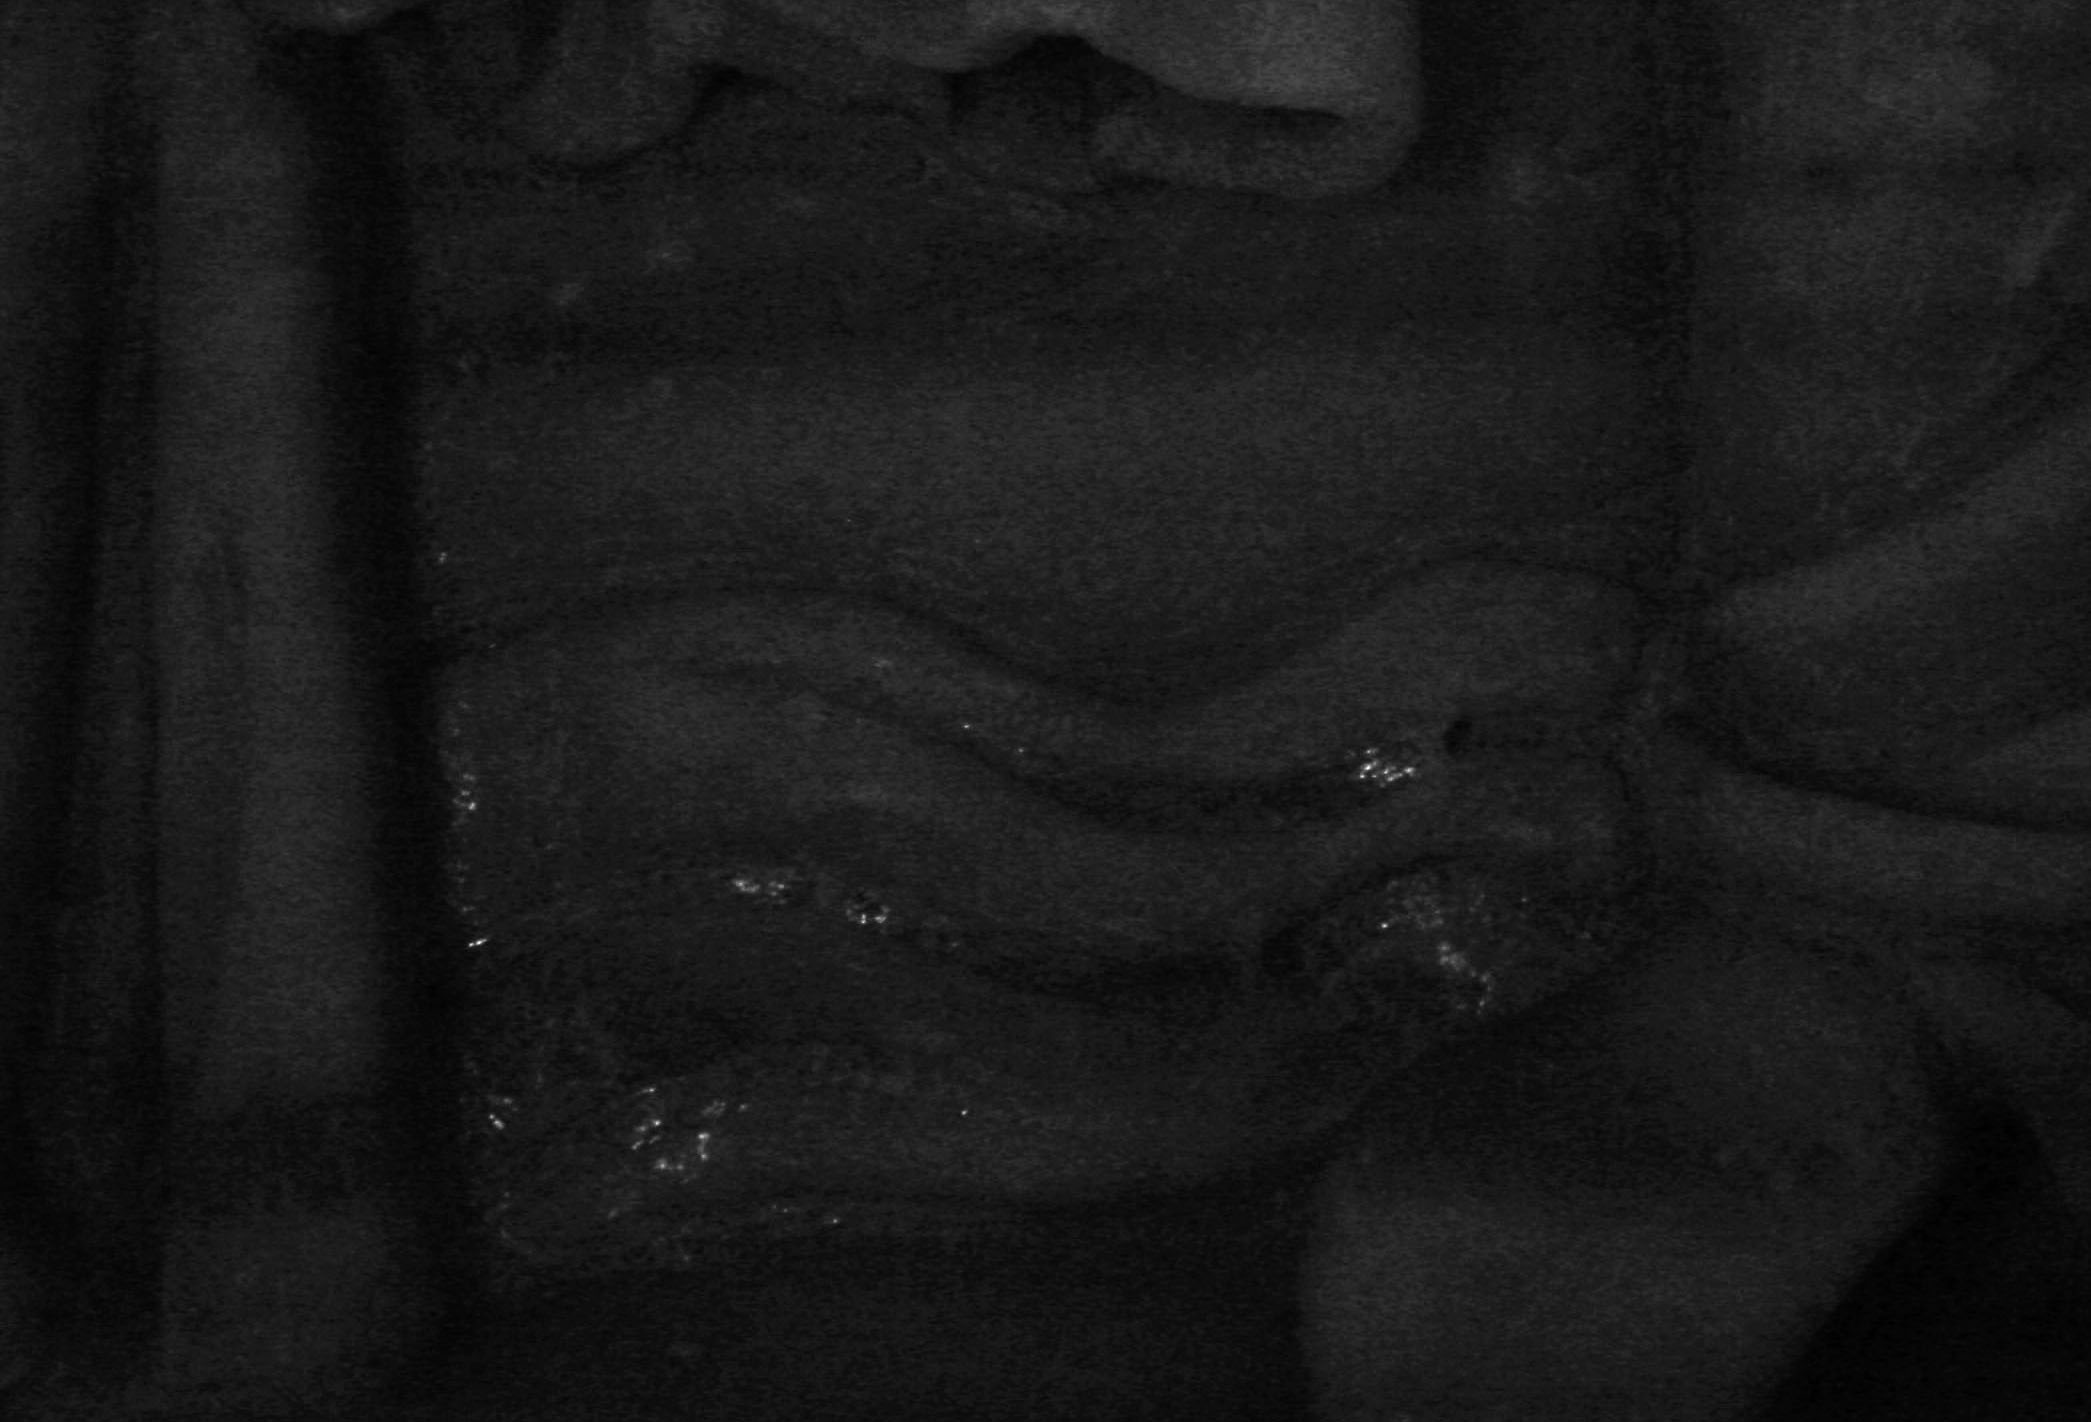
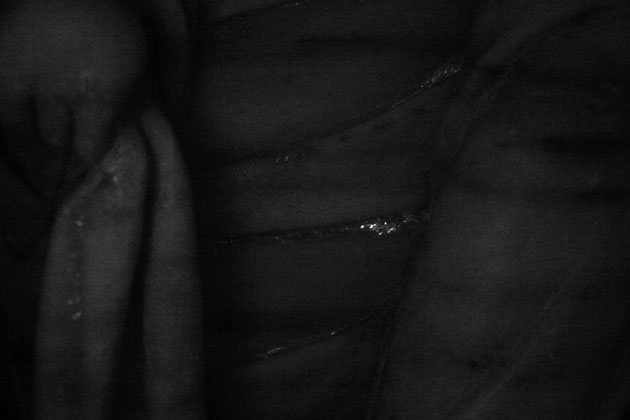
The Visible-inducted Infrared Luminescence (VIL) imaging shows the distribution of glowing white particles of Egyptian blue (EB) on the parapètasma node. Compact layer of EB is especially observed on the prominent areas as applied with wide brushstrokes (Figure 4). |
|
|
|
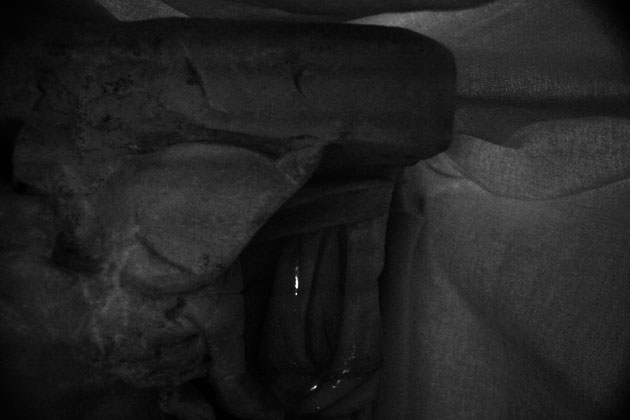
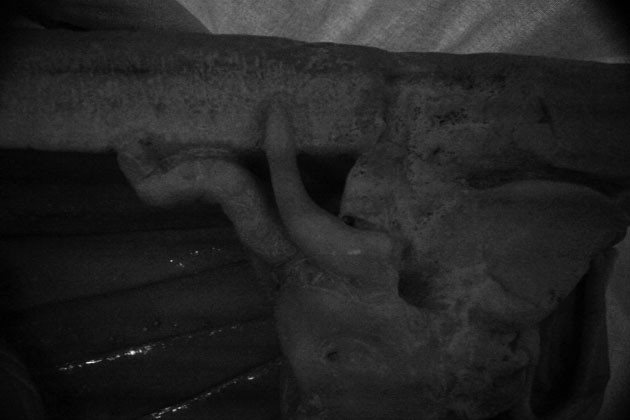
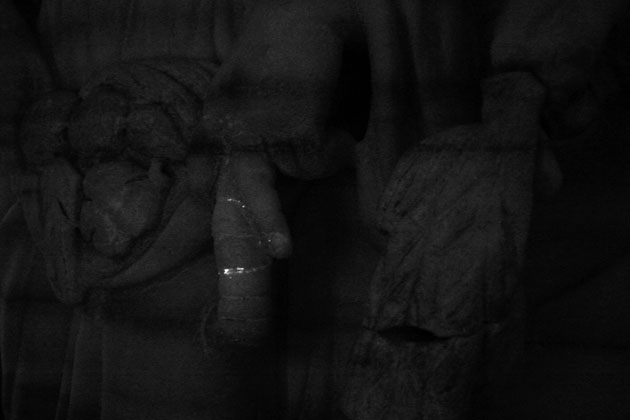
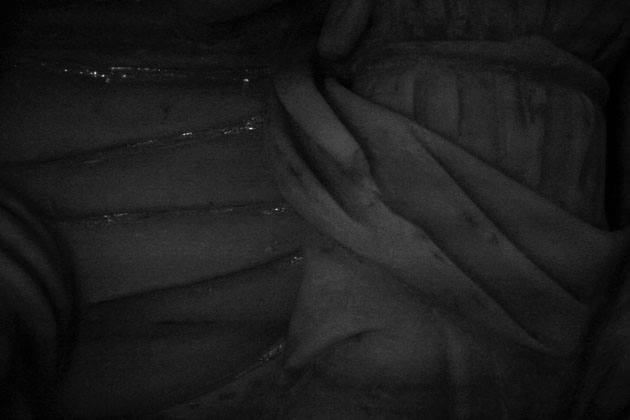
The Visible-inducted Infrared Luminescence (VIL) imaging shows the distribution of glowing white particles of Egyptian blue (EB) on the parapètasma and the cornucopia (Figure 4). Compact bands of EB layer are especially observed along the engraved lines. |
|
|
|
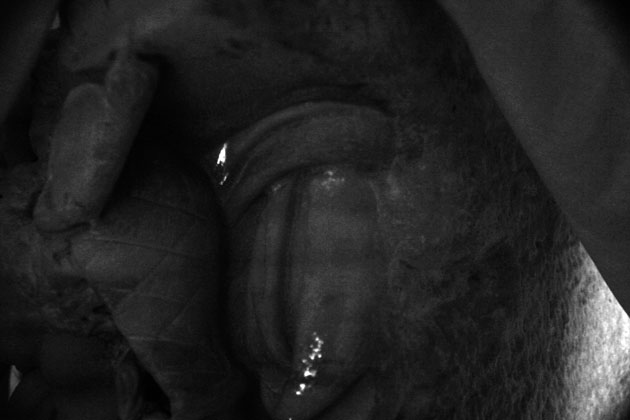
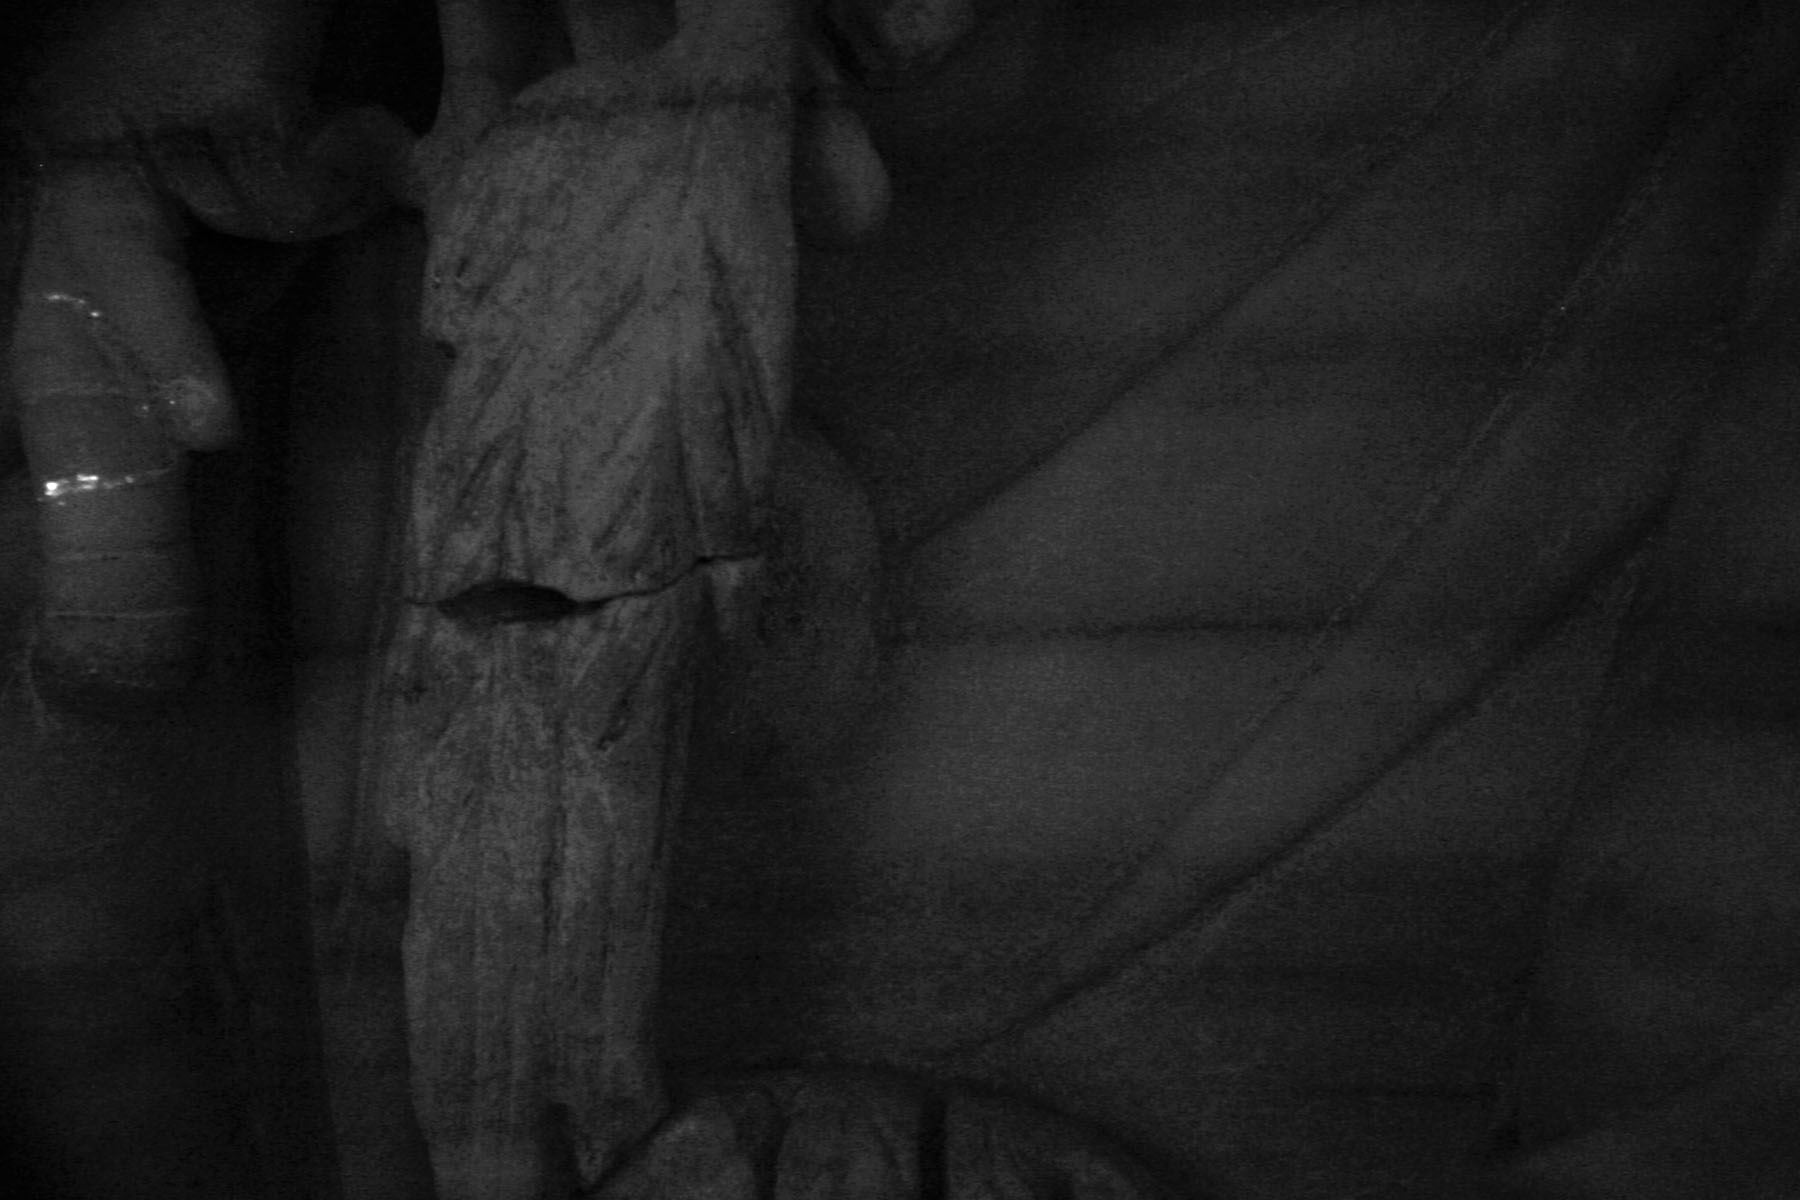
The Visible-inducted Infrared Luminescence (VIL) imaging shows the distribution of glowing white particles of Egyptian blue (EB) on the parapètasma and the cornucopia. Compact layers of EB are especially observed along the engraved lines. |

|
|
|
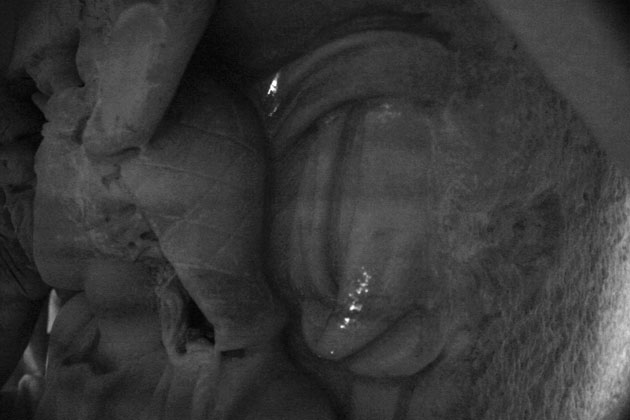
The Visible-inducted Infrared Luminescence (VIL) imaging shows the distribution of glowing white particles of Egyptian blue (EB) on the cornucopia (Figures 1-2) and the parapètasma (figure 3). Compact layers of EB are especially observed along the engraved lines. |
|
|
|
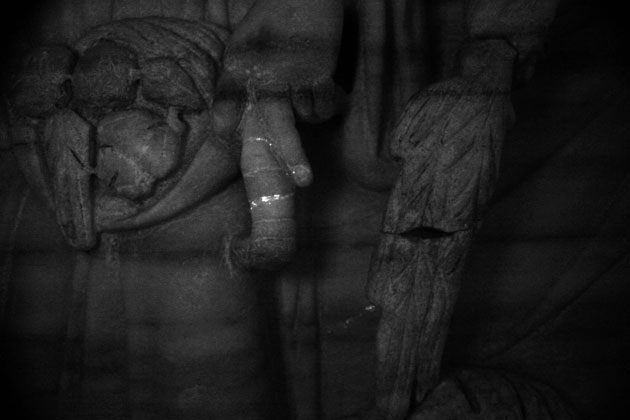
The Visible-inducted Infrared Luminescence (VIL) imaging shows the distribution of glowing white particles of Egyptian blue (EB) on the parapètasma. Compact layers of EB are observed along the engraved lines and on the prominent area (Figure 1). |
|
|
|
The Visible-inducted Infrared Luminescence (VIL) imaging do not shows traces of glowing white particles of Egyptian blue (Figures 1-2). |

|
|
|
The Visible-inducted Infrared Luminescence (VIL) imaging shows the distribution of glowing white particles of Egyptian blue (Figures 1-2). |
|
|
|
The Visible-inducted Infrared Luminescence (VIL) imaging shows the distribution of glowing white particles of Egyptian blue (EB) on the parapètasma (Figures 1-2). Compact layers of EB are preserved along the engraved lines and on the prominent areas (Figure 3). |
|
|
|
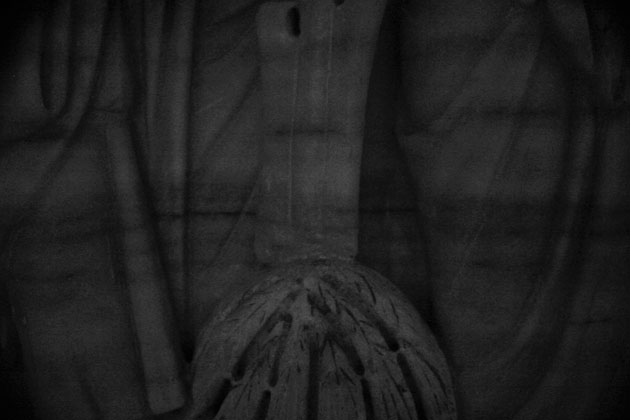
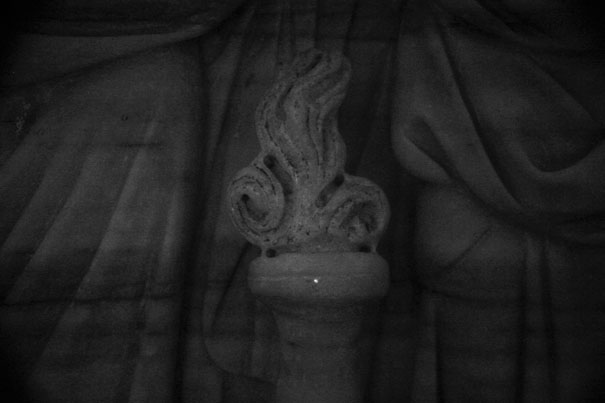
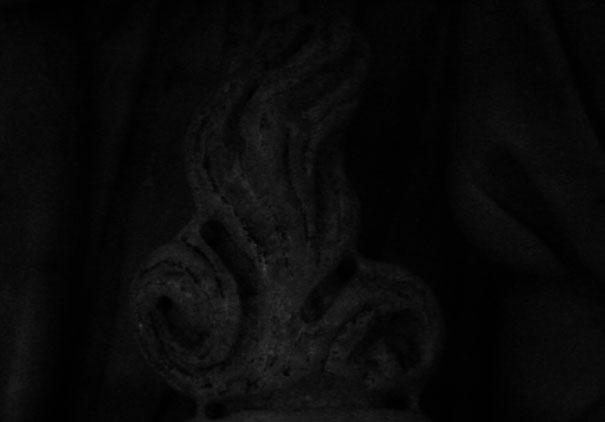
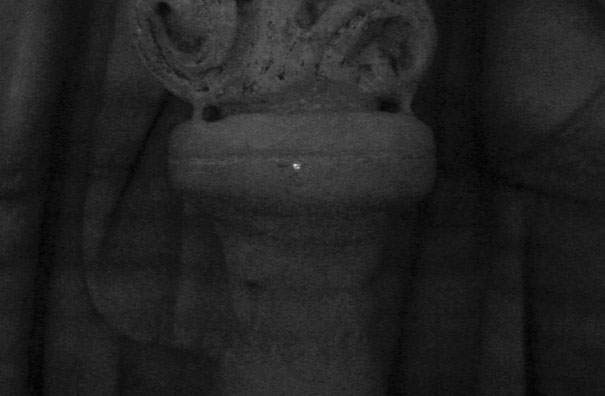
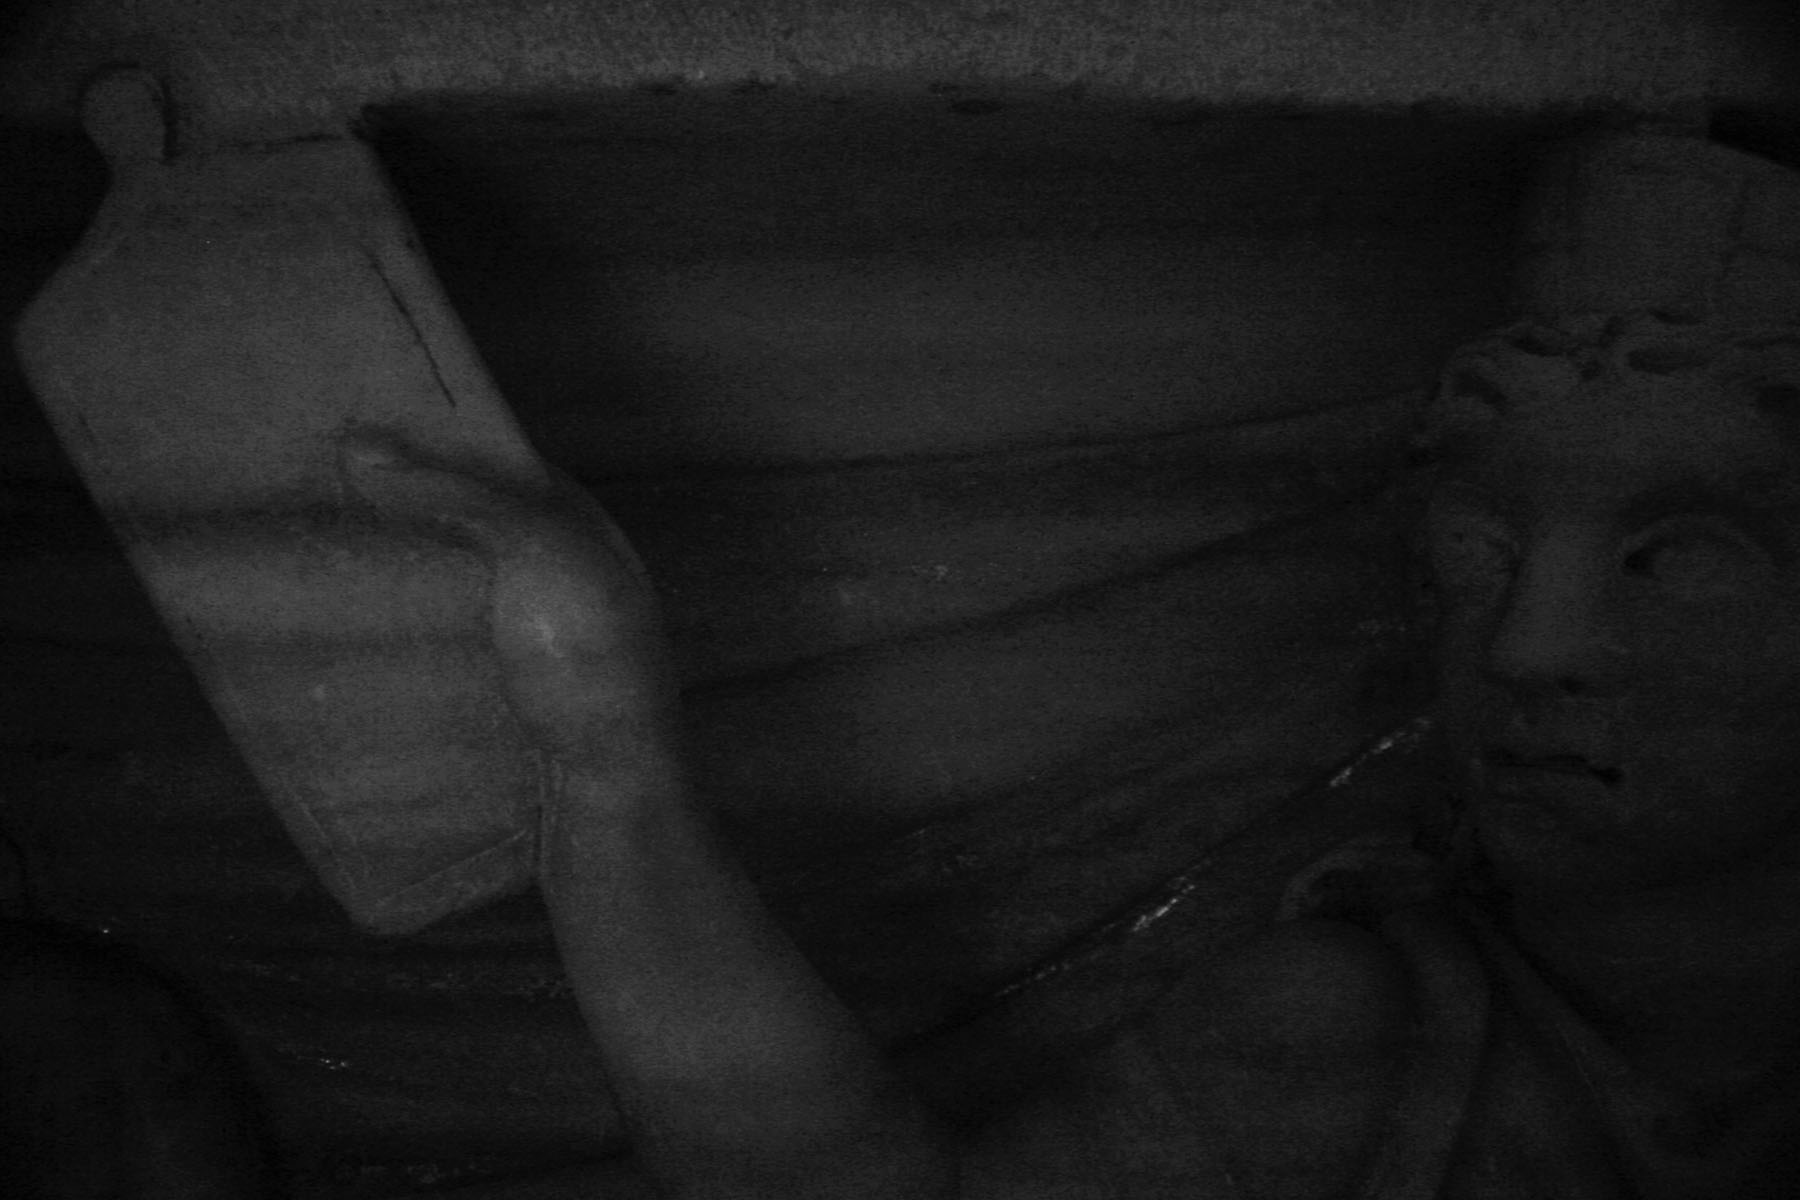
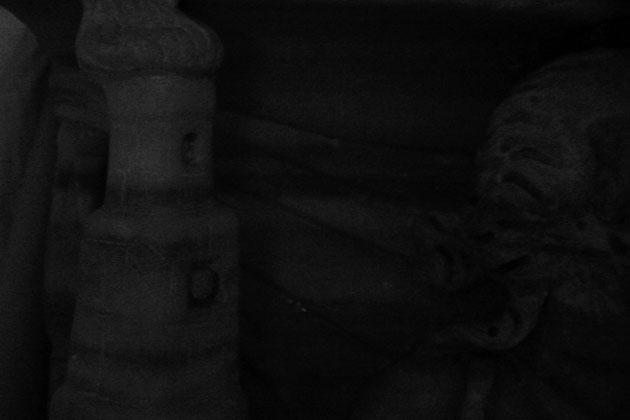
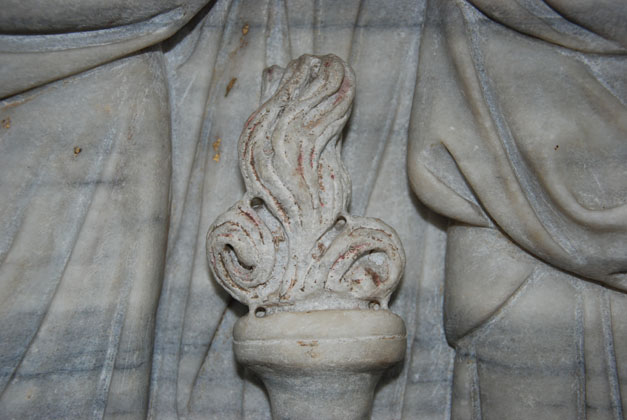
The Visible-inducted Infrared Luminescence (VIL) imaging shows the distribution of glowing white particles of Egyptian blue (EB) on the thymiaterion (Figures 1). On the flame the EB is located as scattered particles (Figure 2), while on the shaft shows a enough compact layer (Figure 3). |
|
|
|
The Visible-inducted Infrared Luminescence (VIL) imaging shows the distribution of glowing white particles of Egyptian blue (EB) on the parapètasma. Compact layers of EB are observed along the engraved lines and on the prominent areas (Figures 1-2). |
|
|
|
The Visible-inducted Infrared Luminescence (VIL) imaging shows the distribution of glowing white particles of Egyptian blue (EB) on the parapètasma. Compact layers of EB are observed along the engraved lines and on the prominent areas (Figures 1-2). |
|
|
|
The Visible-inducted Infrared Luminescence (VIL) imaging shows the distribution of glowing white particles of Egyptian blue (EB) on the parapètasma (Figure 1) and probably under the gold leaf on the palla (Figure 2). |

|
|
|
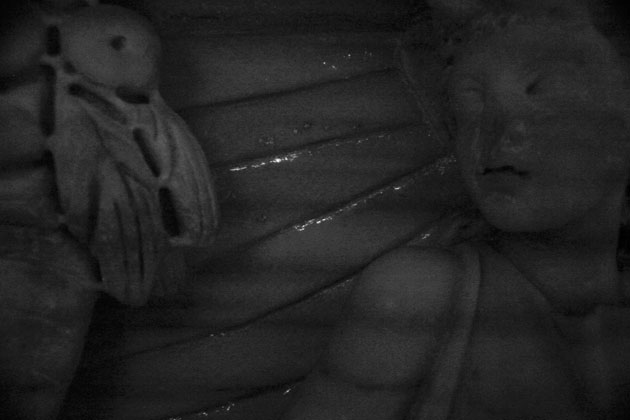
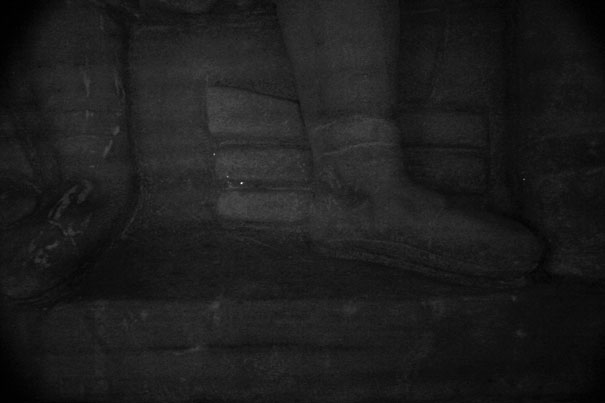
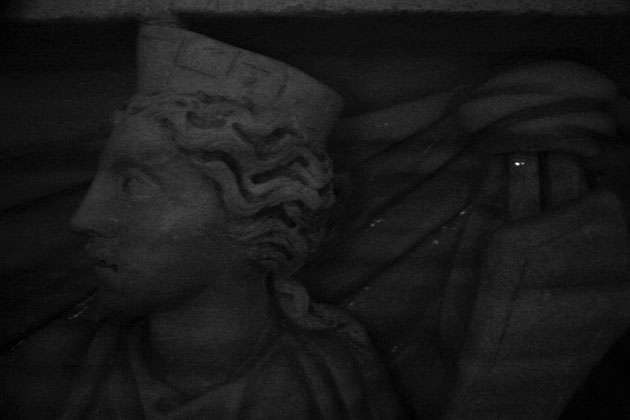
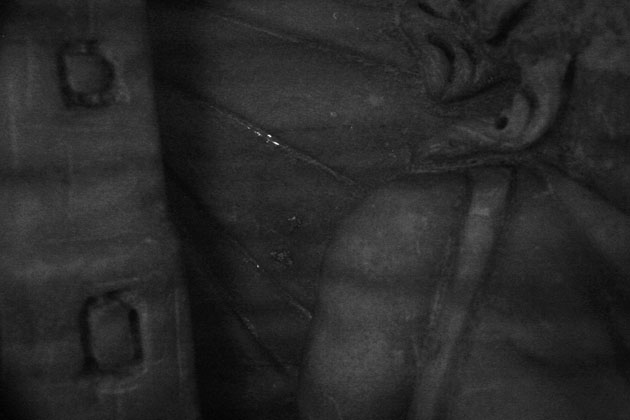
The Visible-inducted Infrared Luminescence (VIL) imaging shows the distribution of glowing white particles of Egyptian blue (EB) on the Annona's stola (Figures 1-2). Specifically a compact layer of EB is seen on its prominent and recessed areas (Figure 3), while on the decoration edge of the palla EB is located as scattered particles (Figure 4). |

|
|
|
The Visible-inducted Infrared Luminescence (VIL) imaging shows the distribution of glowing white particles of Egyptian blue (EB) on the sea waves (Figures 1-2). |
|
|
|
The Visible-inducted Infrared Luminescence (VIL) imaging shows the distribution of glowing white particles of Egyptian blue (EB) on the parapètasma and the palla. |
|
|
|
The Visible-inducted Infrared Luminescence (VIL) imaging shows the distribution of glowing white particles of Egyptian blue (EB) on the parapètasma and the palla. |


|
|
|
The Visible-inducted Infrared Luminescence (VIL) imaging shows the distribution of glowing white particles of Egyptian blue (EB) on the parapètasma. Compact layers of EB are especially observed along the engraved lines. |
|
|
|
The Visible-inducted Infrared Luminescence (VIL) imaging shows the distribution of glowing white particles of Egyptian blue (EB) on the sea waves (Figure 1). |
|
|
|
|

|
|
|
|
|
|
|
Work in progress |
|
|
|
Work in progress |
| Polychome reconstructions |
|
|
|
|
| Hotspots | |
|
|
|
|
|
|
|
|
|
|
|
|
|
|
|
| Views |
|
|
|
|
|
|
|
|
|
|
|
|
|
|


